Introduction
On average, Estonia has a lower agricultural intensity and more natural landscape than the average in the EU. However, monitoring shows a rapid downward trend in biodiversity. Every year, the number of farmland birds in Estonia declines by between 24,000 and 52,000 breeding pairs, and the number of forest birds by 60,000 pairs. Monitoring of agricultural landscapes shows that the species richness and abundance of bumblebees - important pollinators - is significantly lower in the intensive agricultural landscapes of central Estonia than in the more diverse landscapes of southern Estonia. Semi-natural grasslands - our heritage habitats - are among the world's most biodiverse ecosystems and have lost more than 95% of their area in the last 100 years. Estonia has 17% of forests with trees over 81 years old, and only two percent of our forests can be considered as forests with natural dynamics (Estonian Statistical Forest Inventory).
The main factors affecting biodiversity are the loss of traditional heritage stands and landscapes, the intensification of agriculture and the associated increasing homogenisation of agricultural landscapes, the use of pesticides and fertilisers, the rejuvenation and levelling of forests, and the increasing use of grassland and paved areas. Protected areas alone cannot provide for the needs of all species; all landscapes must support biodiversity. In landscapes, every small patch of meadow, patch of trees, edge of a ditch, small pond, or simply a beautifully flowering roadside has a role to play.
In Estonia there is a big gap between the average consumer, the young and the urban citizen's understanding of the importance of preserving the natural environment and the farmer's understanding of it. This is a widening gap, and is also causing some tension in society. On the one hand, the University of Tartu has developed the Green Meter, which is a very good tool for everyone to understand the state of their home environment and also to make recommendations on how to improve it easily. On the other hand, this tool has not been introduced to farmers - neither our agricultural university nor other vocational training institutes make any reference to it, and the preservation and enhancement of biodiversity still plays no part in various subjects. Thus the importance of biodiversity conservation among those who have the greatest impact on it is not being addressed, except In cases where the farmer himself is very interested . However, as a beef cattle farmer, it is easy to implement the various good practices compiled in the Green Meter and on the "Good Field" website.
Description of the innovation
Green Meter is an application that measures the support of Estonia's rural and urban landscapes for the biodiversity characteristic of their ecosystems. The app assesses different landscape parameters within a 500-metre radius around each point on the Estonian mainland using an algorithm developed at the University of Tartu. The Rohemeter identifies and then visualises the areas in the landscape that are less or more supportive of biodiversity in 100x100 metre analysis squares and provides a Rohemeter composite index, varying between 0 and 100, for the observed location, taking into account the surrounding 500 metre radius. Low values of the aggregated index indicate that the landscape structure and changes in the landscape are not favourable for the biodiversity of the area under consideration, while high values indicate landscapes of high biodiversity quality and condition.
Input data for the Green Metric include current, recently collected and historical data on the distribution of habitats and species in Estonia, several layers of maps describing environmental conditions (e.g. peatland drainage ditch network or vegetation cover height model) and indices describing landscape structure. The data used are mainly key data from Estonian national data systems (map layers of the Land Statistical Office, Estonian Nature Information System EELIS, data layers of the Estonian Farming Registers and Information Agency) or international databases (Global Forest Watch, European Union data registers). Some of the data layers used in Green Meter (e.g. landscape indices) have been developed in-house by the University of Tartu. The application also uses Estonian vegetation cover mapping data from 1930-1950 published in the book " Estonian Soviet Vegetation" (Laasimer, 1965), which are held by the Estonian University of Life Sciences and digitised by the University of Tartu. The University of Tartu has also digitised data on the historical distribution of Estonian forests, based on Soviet Union topographic maps and refined with historical vegetation cover mapping data.
The average value of each 100x100 m analysis grid has been calculated on the basis of the parameters of numerous data layers. For each 100x100 m grid, 15 to 40 data layers are used to identify the value from which the displayed value is identified. In total, the application uses more than 70 data layers. The green metric aggregate index - the suitability of the observed landscape for biodiversity - is averaged over a 500-metre radius area for a selected site.
Testimony of the farmer
The land of the Puutsa farm was already in a very good condition in terms of biodiversity, with no drainage, old trees growing in ditches dug 100 years ago to divide the grassland, and with the farm land bordered by a river on one side and a natural stream on the other, there are also many water birds and wetland plants. Using the application of the green metric, I was reassured that everything that has developed on farmland should be preserved and maintained. At the same time, the green meter is a good tool on my rented land, where I can explain to landowners why I implement these practices (partial mowing and no mow strips) as well as advise them to keep trees in the fields and hedges on the land.
"I have used the green meter as a good example in training beef cattle farmers, for example as part of animal welfare training, explaining how cattle welfare is linked to environmental welfare. On the one hand, if we have trees in the pastures, it is a good shade for the animals in the summer months, and on the other hand, trees and bushes are a good habitat for the birds - which in turn help the animals to cope with bleeding insects in the summer months. " - Airi Külvet, Puutsa Farm
The farm report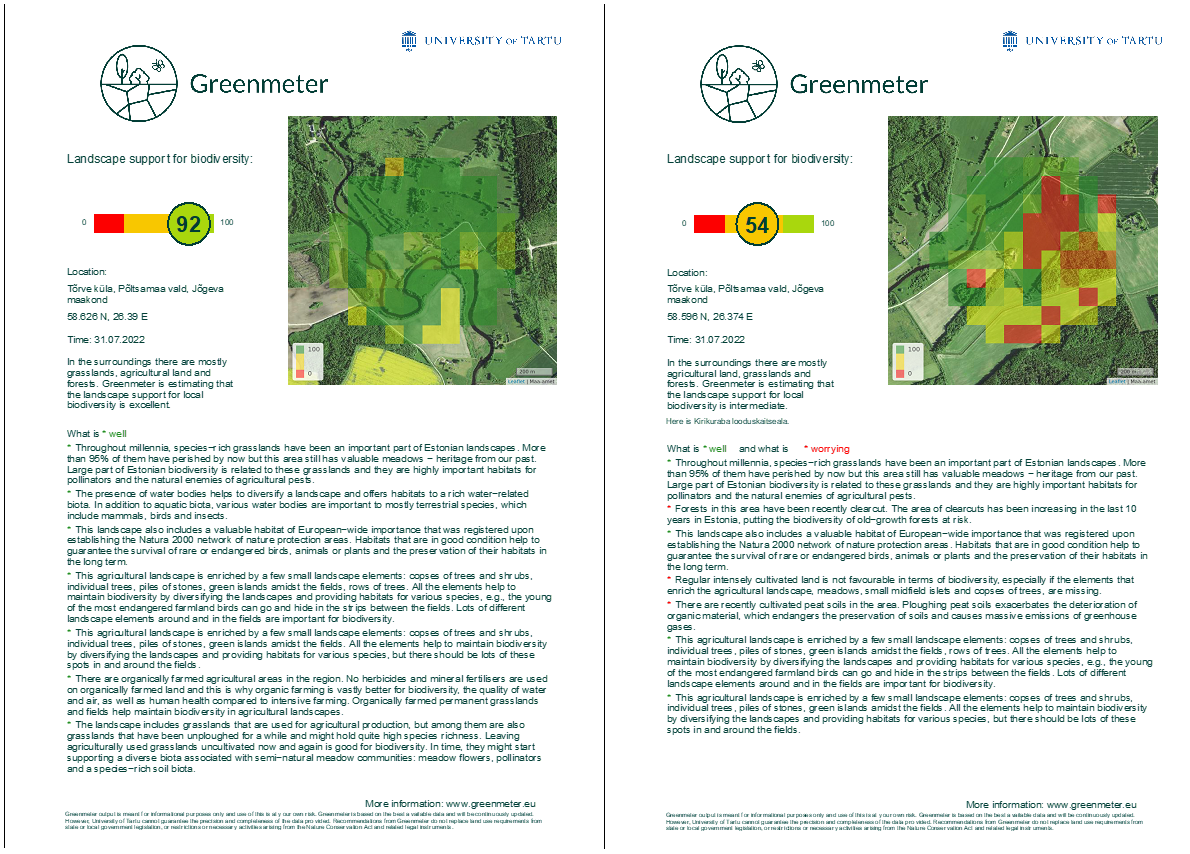 Sources and links
https://greenmeter.eu/about-rohemeeter/
https://shiny.botany.ut.ee/rohemeeter/?lang=en
https://docs.google.com/spreadsheets/d/1dh2UDlERy7RienfBV0mwziHWd9BJ3EOuPr6Q7mdnYhA/edit#gid=0